After reading this post, you will understand the difference between solar payback period and cash-on-cash return, know which metric answers which question, and be able to pick the right one for your situation before signing a contract. Both numbers appear in installer proposals and online calculators, often with different results, and mixing them up leads to bad comparisons and misplaced expectations.
Why Two Metrics Exist for the Same System
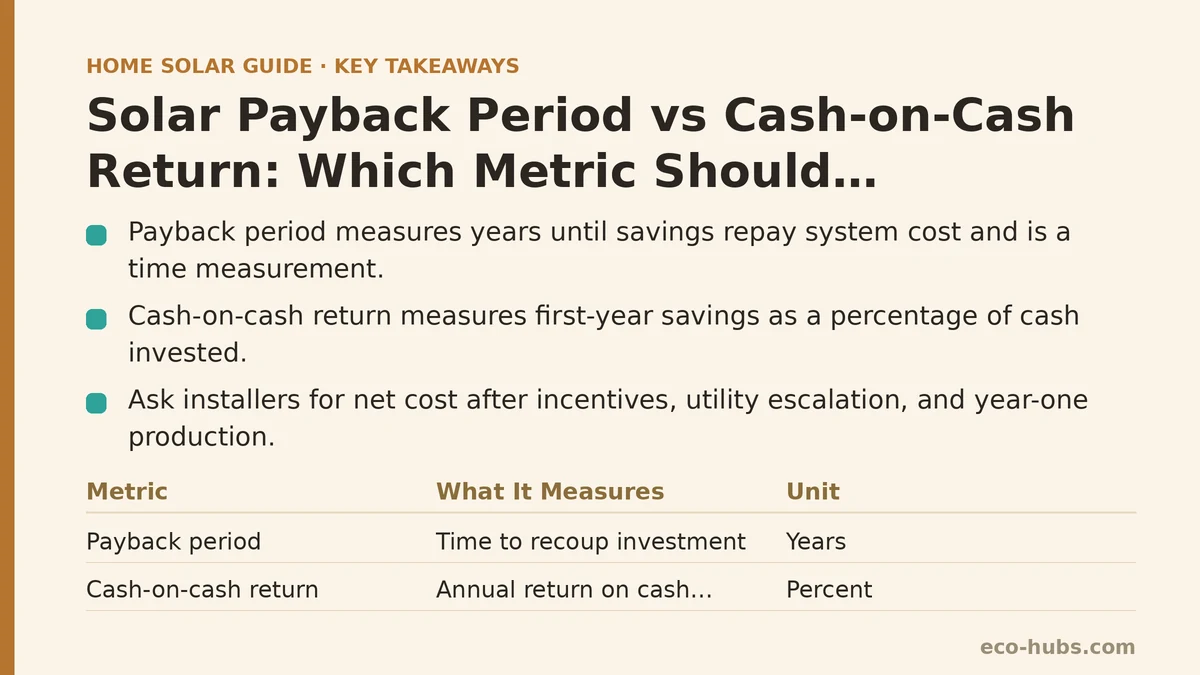
Payback period asks a simple question: how many years until the money you spent has come back to you through savings? It is a time measurement, expressed in years. A typical residential system in a mid-range electricity market commonly shows a payback period somewhere between 7 and 12 years, depending on utility rates, system cost, and how much of your usage the panels offset.
Cash-on-cash return asks a different question: in a single year, what percentage of the cash you invested does the system return? It is a rate, expressed as a percentage. A system costing $20,000 that produces $2,000 in first-year savings delivers a 10% cash-on-cash return before accounting for financing costs or escalation.
Neither metric is wrong. They simply answer different questions, and confusion often starts when a proposal swaps one for the other without labeling which is which.
Symptom → Cause → Fix: Common Problems Homeowners Run Into
This section walks through the mistakes that come up most often, why they happen, and what to do about them.
Symptom: Your installer’s payback number looks much shorter than a calculator you found online
Cause: Payback calculations vary widely based on assumptions. Some quotes exclude the federal tax credit from the net cost. Others assume utility rates rise at 4-5% per year while others use 2%. Some count only electricity offset, others include net metering credits at retail rate.
Fix: Ask the installer for the three assumptions that drive their number: (1) net cost after incentives, (2) assumed annual utility rate escalation, (3) assumed production in year one. Recalculate with your own numbers. If the payback drops below roughly 6 years, one of these inputs is probably optimistic.
Symptom: You mixed up payback and cash-on-cash return when comparing two quotes
Cause: Both numbers are often described as “your return.” A 12% figure could be a first-year cash-on-cash return or a lifetime internal rate of return. A “10-year” figure is clearly payback, but a “10%” figure is ambiguous without a label.
Fix: For each quote, write down both metrics side by side. If the installer only provides one, ask for the other. A quote that looks strong on payback may look weaker on cash-on-cash return once financing is included, and vice versa.
Symptom: Your cash-on-cash return dropped after the first year
Cause: Cash-on-cash return is typically quoted as first-year savings divided by cash invested. In later years, the denominator can change if you put more cash in (for example, a battery replacement in year 12) or if you refinance the system.
Fix: Understand whether the quoted cash-on-cash return is a first-year snapshot or an average over the system’s life. A first-year number is standard, but if the installer applies it to multiple years, the comparison is no longer apples-to-apples.
Symptom: You financed the system and the cash-on-cash return looks negative
Cause: Cash-on-cash return is meant to compare annual cash flow to cash invested. If you financed with $0 down, your cash invested is near zero, which makes the ratio undefined or misleading. Meanwhile, your annual loan payment may exceed your annual savings in the early years.
Fix: For financed systems, use payback period on a cash-flow basis (when cumulative savings exceed cumulative loan payments) instead of cash-on-cash return. Alternatively, calculate cash-on-cash return only on any down payment you made, and note clearly that this understates the leverage risk.
Symptom: A system with strong payback looks worse than one with strong cash-on-cash return
Cause: A lower-cost system often has the shortest payback period. A higher-cost system with a battery or premium panels may have a lower payback period but a higher cash-on-cash return in later years once utility rates have risen. The two metrics diverge whenever cash flows are uneven over time.
Fix: Decide which question matters more to you. If you plan to sell the home within 5-7 years, payback period is typically more relevant because the next owner inherits the remaining savings. If you plan to stay 15+ years, cash-on-cash return on a year-by-year basis better reflects the ongoing yield.
Symptom: You cannot tell which metric your state incentive program is quoting
Cause: Some state programs quote simple payback, others quote internal rate of return, and some quote cash-on-cash return. The terms are sometimes used loosely in marketing materials.
Fix: Look for the units. Payback is expressed in years. Cash-on-cash return is expressed as a percentage. Internal rate of return (IRR) is also a percentage but accounts for the time value of money over the full system life, which is a third distinct metric and should not be confused with the other two.
How Each Metric Is Calculated
Payback Period (Simple)
Formula: Net system cost ÷ First-year annual savings = Payback in years
Example: A $16,000 net cost system (after the 30% federal tax credit) saving $1,600 in year one has a simple payback of 10 years. If savings escalate at 3% annually while utility rates rise, the real payback is closer to 8.5 years because later years contribute more dollars. Simple payback ignores that escalation, so it typically overstates the actual time to break even.
Cash-on-Cash Return
Formula: Annual pre-tax cash flow ÷ Total cash invested = Cash-on-cash return
Example: $1,600 in first-year savings on $16,000 invested is a 10% cash-on-cash return. If the system was financed with $3,000 down and the loan payment is $1,400 per year while savings are $1,600, the annual cash flow is $200 on $3,000 invested, which is a 6.7% cash-on-cash return. That number looks worse than the all-cash version, which reflects the added cost of borrowing.
When to Use Which Metric
| Situation | Recommended Metric | Why |
|---|---|---|
| Planning to sell home within 7 years | Payback period | Measures how much value transfers with the home |
| Planning to stay 15+ years | Cash-on-cash return (year by year) | Reflects ongoing yield as rates rise |
| All-cash purchase | Both | They complement each other; payback for timing, cash-on-cash for yield |
| Financed with low down payment | Payback on a cash-flow basis | Cash-on-cash return is distorted by near-zero denominator |
| Comparing to other investments (bonds, CDs) | Cash-on-cash return | Same unit (percentage) makes comparison easier |
| Comparing two installer quotes | Both, with identical assumptions | Payback catches cost differences, cash-on-cash catches yield differences |
A practical rule: use payback period to screen out systems that take too long to break even, then use cash-on-cash return to rank the survivors.
The Assumptions That Change Both Metrics
Small changes in inputs move both numbers more than most homeowners expect. The table below shows how a single system with a $16,000 net cost and $1,600 in year-one savings shifts when assumptions change.
| Assumption | Payback Period | First-Year Cash-on-Cash |
|---|---|---|
| Base case | 10.0 years | 10.0% |
| Utility rates rise 3%/yr | 8.5 years (cumulative) | 10.0% year one, rising after |
| Production estimate cut 15% | 11.8 years | 8.5% |
| System cost up 20% | 12.0 years | 8.3% |
| Federal credit reduced to 0% | 14.3 years | 7.0% |
Production estimates are the input most often inflated in quotes. A system that produces 15% less than promised (due to shading, orientation, or panel degradation) pushes payback out by roughly two years and cuts cash-on-cash return by about a fifth.
A Short Self-Check Before You Compare Quotes
- Confirm both metrics are quoted on the same net cost basis (after all incentives).
- Confirm the same assumed utility rate escalation is being used.
- Confirm the same production estimate is used as the basis for savings.
- Confirm the cash-on-cash return is labeled as first-year, not lifetime average.
- Confirm whether financing costs are subtracted before or after the metric is calculated.
- Confirm whether degradation (typically 0.5% per year for modern panels) is included.
If any of these are missing from a quote, ask before comparing. A 2% difference in assumed utility escalation can move payback by more than a year, which is larger than the differences homeowners often use to pick between installers.
What To Do Next
- Pull the two most recent quotes you have (or request quotes if you do not yet have them).
- For each, calculate simple payback and first-year cash-on-cash return on a consistent basis using the assumptions listed above.
- If you plan to stay in the home less than 7 years, weight payback more heavily. If you plan to stay 15+ years, weight cash-on-cash return more heavily.
- If you financed, ignore the headline cash-on-cash return and use the cash-flow payback method instead.
- Before signing, ask the installer to put their payback and cash-on-cash assumptions in writing, including production estimate, utility escalation, and net cost after incentives.
Both metrics are useful, but they are not interchangeable. The one you should use depends on how long you plan to own the system and how you paid for it. If you have two quotes in hand and want help comparing them on the same basis, describe the numbers and assumptions here and we can walk through where they diverge.
Related guides: How to Actually Calculate Your Solar Panel Payback Period, Solar Lease vs Buy: An Honest Comparison Based on the Actual Numbers, and Combining Solar With Heat Pumps: What Homeowners Should Know.
🔗 Recommended Reading
- How to Read Your Electricity Bill After Solar: A Line-by-Line Walkthrough
- Solar Incentive Paperwork: Common Filing Mistakes That Delay Your Rebate
- Home Battery Sizing Mistakes That Lead to Blackout Regret
- Common Solar Installer Mistakes Homeowners Should Catch Before Signing
- Common Home Battery Storage Wiring and Placement Mistakes to Avoid