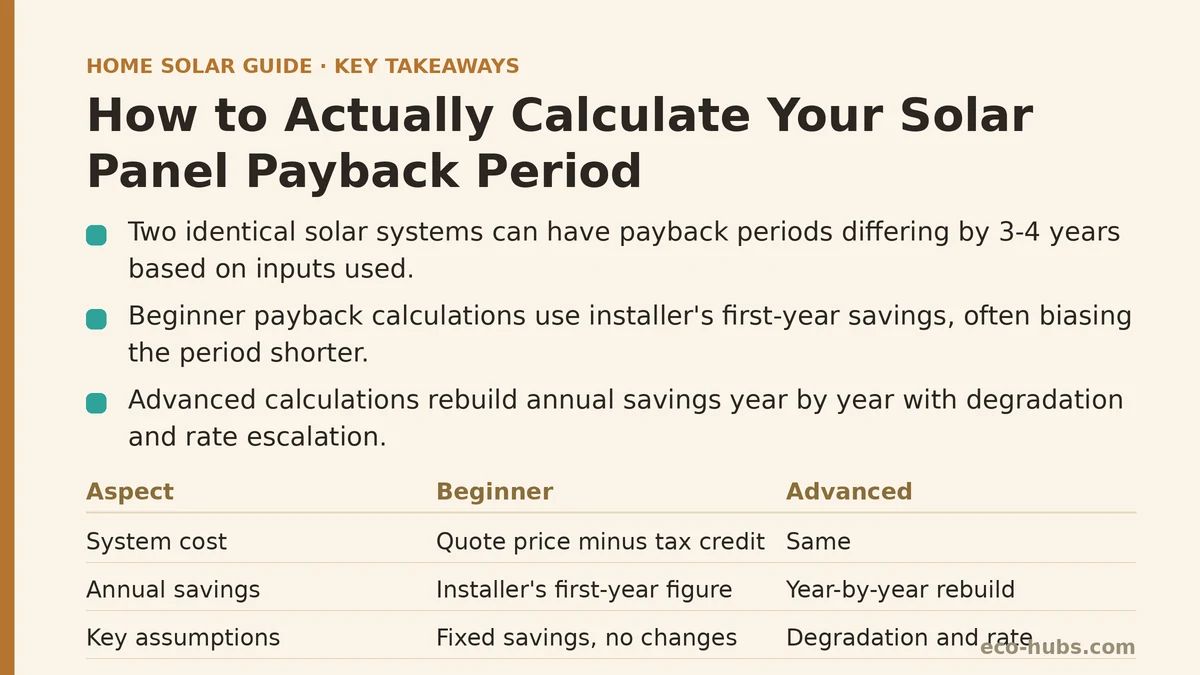
Here is something most quotes leave out: two homes with identical panels, identical roofs, and identical electricity rates can have payback periods that differ by three or four years. The gap has nothing to do with equipment quality. It comes from which inputs got included in the math and which ones were quietly assumed away.
The formula itself is not the problem. Total system cost divided by annual savings is arithmetic a fifth grader could handle. What produces wildly different answers is what goes into each side of that division, and how much effort someone puts into getting those numbers right before trusting the result.
The Formula Both Groups Start From
Every payback calculation, beginner or advanced, starts in the same place: net system cost after incentives, divided by what the system saves you per year on electricity. If a system costs $18,000 after the tax credit and saves $1,800 annually, that’s a ten-year payback. Nobody disputes this part of the process.
Where beginner and advanced approaches diverge is in how each side of that equation gets built. A beginner calculation tends to take the installer’s numbers at face value. An advanced calculation treats those same numbers as a starting point that needs to be stress-tested before it goes into any formula.
Beginner Calculation: Using the Numbers You Were Given
For someone running their first payback estimate, the natural approach is to take the quote’s system price, subtract the tax credit percentage discussed in our tax credit guide, and divide by the first-year savings figure the installer provided. This produces a clean, single number, and for a rough sense of whether solar is worth exploring at all, it is not a bad starting point.
The limitation is that this number reflects one specific year — usually the first — projected forward as if nothing about your electricity usage, utility rates, or system output will change for a decade. That assumption rarely holds, and it tends to bias the payback period shorter than what actually plays out.
Advanced Calculation: Rebuilding the Inputs Before Trusting Them
A more careful approach starts by pulling apart the installer’s production estimate. What shading assumptions were used? What panel orientation and tilt were assumed? Utility rate escalation is another input worth checking independently — many installer projections assume a modest 2 to 3 percent annual increase, when many regions have seen utility rates climb considerably faster than that over the past decade.
Someone comfortable working through a spreadsheet can rebuild the annual savings figure year by year: apply a realistic degradation rate to panel output (typically around 0.5 percent per year), apply a rate escalation assumption drawn from your own utility’s historical filings rather than a generic industry average, and only then divide total system cost by the resulting stream of savings. This produces a payback period that moves — sometimes shorter, sometimes longer — than the flat first-year projection would suggest.
Beginner Blind Spot: Treating Annual Savings as a Fixed Number
The most common mistake in a beginner calculation isn’t a math error — it’s an omission. Treating year-one savings as representative of every year that follows ignores two forces working in opposite directions: panel degradation, which slowly reduces how much electricity the system produces, and utility rate increases, which slowly increase how much each kilowatt-hour of avoided grid electricity is worth.
Because these two forces partially offset each other, a flat first-year estimate is sometimes closer to accurate than it has any right to be — but relying on that coincidence rather than checking the actual numbers for your utility and system size is a gamble, not a calculation.
Advanced Refinement: Modeling Degradation and Rate Escalation Together
An advanced approach models both curves explicitly rather than hoping they cancel out. Take the manufacturer’s stated degradation rate from the product specification sheet, apply it compounding year over year against the system’s rated output, and separately apply your utility’s actual rate escalation history to the value of each kilowatt-hour saved. Multiply the two together for each year, and you get a savings figure that shifts gradually rather than staying flat.
This modeling reveals something a flat estimate hides entirely: in utility territories with fast-rising rates, the true payback period can land earlier than a simple first-year calculation suggests, because rising electricity prices outpace the panels’ slow output decline. In territories with flat or falling rates, the opposite can happen.
Beginner Shortcut: Ignoring Tax Credit Timing
A subtle error in many first-pass calculations is treating the tax credit as an upfront discount on the system price, applied the same day the system is installed. In practice, the credit is claimed on the following year’s tax return, which means the money doesn’t reduce your net cost until months after installation — and only if you have sufficient tax liability to claim the full amount that year.
For a beginner estimate, this timing gap is usually close enough to ignore. It shifts payback by a fraction of a year at most, and for a rough sense of whether solar makes financial sense, that fraction rarely changes the conclusion.
Advanced Adjustment: Simple Payback vs. Net Present Value
For someone who wants a more rigorous number, simple payback period has a real limitation: it treats a dollar saved in year one the same as a dollar saved in year fifteen, ignoring the time value of money entirely. A net present value calculation, which discounts future savings back to today’s dollars using an assumed discount rate, gives a more conservative and arguably more honest picture of the investment.
This distinction matters most for homeowners financing the system rather than paying cash, since the interest paid on a solar loan reduces the effective savings each year in a way that a simple payback formula doesn’t account for at all. An advanced calculation folds loan interest into the annual savings figure directly, rather than treating financing as a separate consideration from the payback math.
Where the Two Approaches Tend to Land
In moderate climates with average utility rate increases, the beginner and advanced calculations often converge within a year of each other — close enough that the extra spreadsheet work may not change your decision. In regions with fast-rising electricity rates, heavy shading, or financed rather than cash-purchased systems, the gap between the two approaches widens considerably, sometimes by two to three years in either direction.
Knowing which situation you’re in before committing to a system is worth the extra hour of work, particularly since payback period is one of the few numbers in a solar quote that directly compares to what you’d earn leaving that same money in a typical investment account instead.
A Side-by-Side Look at the Two Approaches
| Input | Beginner Approach | Advanced Approach |
|---|---|---|
| System cost | Quote price minus tax credit percentage | Same, plus verified equipment specs |
| Annual savings | Flat first-year estimate | Modeled year by year with degradation |
| Utility rate change | Assumed generic 2–3% | Based on your utility’s actual history |
| Tax credit timing | Treated as immediate discount | Applied in the correct claim year |
| Financing costs | Often excluded | Factored into net annual savings |
| Time value of money | Not considered | Reflected through NPV, where relevant |
Building Your Own Number
If you’re weighing a quote right now, start with the beginner formula to see whether the rough payback period is in a range that interests you at all. If it is, go back and rebuild the annual savings line using your own utility’s rate history and the manufacturer’s stated degradation rate rather than the installer’s generic assumptions — that single adjustment tends to move the final number more than any other input discussed here.
What does your quote currently assume for rate escalation, and have you checked that assumption against your own utility’s rate history over the past several years? That single comparison is often enough to tell you whether the payback period you were quoted deserves your confidence or a second look. Related guides: Solar Payback Period: How to Calculate It by Hand Without a Calculator App, Solar Payback Period vs Cash-on-Cash Return: Which Metric Should Homeowners Use, and A Financial Advisor’s Guide to Calculating Client Solar ROI Scenarios.
🔗 Recommended Reading
- Solar Panel Monitoring Apps: A Setup Guide for Beginners
- How to Read Your Electricity Bill After Solar: A Line-by-Line Walkthrough
- Solar Incentive Paperwork: Common Filing Mistakes That Delay Your Rebate
- Home Battery Sizing Mistakes That Lead to Blackout Regret
- Common Solar Installer Mistakes Homeowners Should Catch Before Signing