Here is the part most manufacturer brochures leave out: a panel’s first year of service is typically its worst year for degradation, sometimes losing as much output in twelve months as it will lose across the next five combined. The smooth, steadily descending line on a spec sheet is a projection, not a measurement, and real systems rarely decline in a straight path.
To see what a full 25-year window actually looks like, it helps to follow one system from installation to old age rather than talk in averages. The case below draws on a 7.2 kW residential array installed in Arizona in 2011, monitored continuously since activation, with production logs available for every year of its operation to date and manufacturer projections for the years still ahead.
Year One: The Steepest Drop Happens Immediately
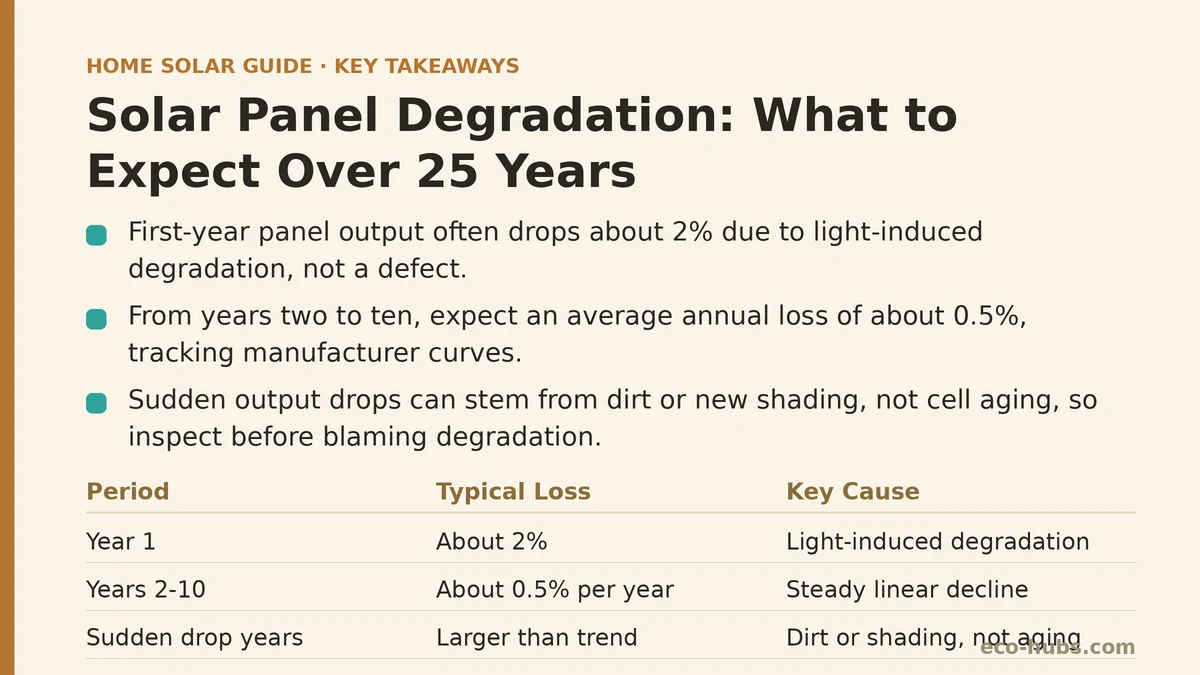
This system’s panels were rated at 260 watts each at the factory. Within the first twelve months of exposure to sunlight, output measured roughly 2% below that rating — a phenomenon known as light-induced degradation, where the panel’s internal structure stabilizes once real sunlight replaces the factory testing conditions. This isn’t a defect or a sign of premature failure. It’s baked into how crystalline silicon panels behave, and most manufacturer warranties account for it by setting the guaranteed output for year one lower than the nameplate rating.
Homeowners who check their production numbers closely in the first year sometimes worry when output falls slightly short of the number on the spec sheet. In a system operating normally, this initial dip is expected and does not predict how the rest of the panel’s life will unfold.
Years Two Through Ten: The Long, Quiet Decline
After the first-year adjustment, this array settled into a much steadier pattern — an average annual loss of about 0.5%, consistent with the linear degradation rate that most reputable manufacturers publish and stand behind in their warranty terms. By year ten, cumulative output measured roughly 6.5% below the original nameplate rating, tracking almost exactly with the manufacturer’s own performance curve.
This decade is where degradation is easiest to underestimate, precisely because nothing dramatic happens. There’s no single event to point to — just a slow erosion of a fraction of a percent per year, invisible on a monthly electric bill but measurable when comparing production data across full calendar years. Homeowners relying on memory rather than logged data often assume their system is performing identically to installation day, when in reality it has already given up a modest, expected slice of its original capacity.
The Year Fourteen Anomaly: When Degradation Isn’t the Real Culprit
At year fourteen, this system’s production dropped more sharply than the linear trend would predict — a loss noticeably larger than any prior single-year decline. This is where degradation gets confused with other causes, and it’s worth separating the two clearly.
An inspection traced the drop to two compounding issues that had nothing to do with cell aging: a buildup of dust and pollen on several panels that hadn’t been cleaned in years, and a section of shading from a neighboring tree that had grown considerably since installation. Once the panels were cleaned and the affected branches were trimmed, output recovered to within a fraction of a percent of where the linear degradation trend predicted it should be.
The lesson from this year of data is one worth generalizing: a sudden production drop is far more likely to signal soiling, shading, a loose connection, or an inverter issue than accelerated cell degradation. True degradation is slow and cumulative. Anything that looks like a cliff rather than a gentle slope deserves an inspection before it gets attributed to the panels simply wearing out.
Comparing Real Data to the Warranty Projection
Most manufacturer performance warranties guarantee that a panel will still produce at least 80% to 85% of its original rated output at the 25-year mark, with a specified linear decline permitted in between. Checking this system’s actual year-fourteen-corrected data against its manufacturer’s published warranty curve showed real-world performance running slightly ahead of the guaranteed minimum — a small but meaningful cushion that reflects how conservatively many manufacturers set their published figures relative to typical real-world results.
That gap matters for a specific reason: the warranty is a floor, not a forecast. Panels that perform exactly to their warranty minimum are, in a sense, underperforming relative to what similar equipment typically achieves in the field. This system’s data suggests that treating the warranty number as the expected outcome, rather than the worst acceptable outcome, would have understated its real production for over a decade.
Years Fifteen Through Twenty-Five: Projecting the Remaining Curve
With eleven more years of data still to be collected, the remaining projection for this system relies on extending its established 0.5% annual rate forward, adjusted for the corrected trend established after the year-fourteen maintenance issue was resolved. Under that projection, output at year twenty-five would land around 82% of original nameplate rating — comfortably inside the manufacturer’s guaranteed range, and consistent with what a well-maintained system of this panel type and age would typically be expected to deliver.
It’s worth being honest about the limits of this kind of projection. A panel’s true 25-year output depends on variables no forecast fully captures: microcracks from severe hail or thermal cycling, connector or junction box degradation, inverter replacements along the way, and how consistently the system gets cleaned and inspected. The projection is a reasonable estimate built on a solid trend line, not a guarantee independent of ongoing care.
What This Case Suggests for Homeowners Weighing a Long-Term Investment
Pulling the pattern together across this system’s first fourteen years — and projecting the remainder — a few things stand out clearly enough to generalize beyond this one installation.
- The steepest single-year loss usually happens immediately, in year one, not gradually over decades.
- A slow, roughly half-percent annual decline is normal and does not indicate a problem.
- Sharp, sudden drops almost always trace back to soiling, shading, or equipment issues rather than accelerated cell aging.
- Manufacturer warranty minimums tend to run more conservative than typical real-world performance, meaning actual output often outpaces the guaranteed floor for much of the system’s life.
- Routine maintenance — cleaning, trimming nearby growth, checking connections — has a larger effect on long-term output than most homeowners assume going in.
None of this changes the basic math behind a solar investment, but it does change how a homeowner might interpret their own production numbers year to year. A dip is not automatically a sign of failing equipment, and a system that seems to be holding steady may simply be degrading exactly as expected, quietly and on schedule.
If you have production data from your own system, even a few years of it, comparing your year-over-year trend against your panel’s published warranty curve is one of the more useful checks you can run. Tell us how old your system is and what you’re seeing in your own numbers, and we can help you figure out whether it’s tracking normally or worth a closer look.
Related guides: Solar Panel Efficiency Degradation Over Time: What Actually Slows Down, Solar Panel Maintenance: What to Actually Expect Over Time, and Solar Panel Financing Options: What Actually Differs Between Loan Types.
🔗 Recommended Reading
- Solar Panel Monitoring Apps: A Setup Guide for Beginners
- How to Read Your Electricity Bill After Solar: A Line-by-Line Walkthrough
- Solar Incentive Paperwork: Common Filing Mistakes That Delay Your Rebate
- Home Battery Sizing Mistakes That Lead to Blackout Regret
- Common Solar Installer Mistakes Homeowners Should Catch Before Signing