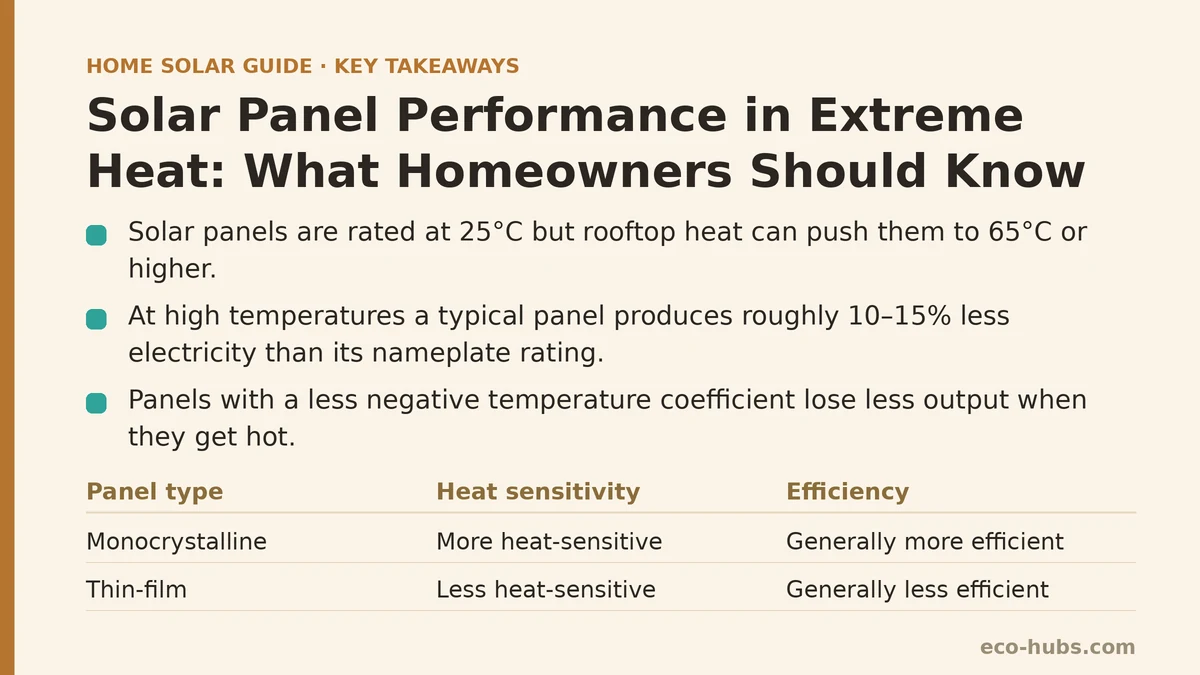
Solar panels are rated at 25°C (77°F), but rooftop conditions in summer routinely push them to 65°C or higher. At that temperature, a typical panel produces roughly 10–15% less electricity than its nameplate rating — the same percentage swing most homeowners expect from a full day of clouds. The counterintuitive part is that the hottest, sunniest days of the year are not necessarily your best production days.
The Temperature Coefficient: Your Panel’s Heat Sensitivity Score
Every solar panel datasheet lists a temperature coefficient, usually expressed as a percentage per degree Celsius, such as −0.35%/°C. This number tells you how much power the panel loses for each degree the panel itself rises above 25°C. A panel with a coefficient of −0.35%/°C running at 65°C loses 14% of its output — 40 degrees above the rating point, multiplied by the coefficient.
Panel temperature is not the same as air temperature. A dark panel absorbing sunlight on a 35°C day can sit 25–30 degrees hotter than the surrounding air. This gap between ambient temperature and panel temperature is why you will see production dip on calm, hot afternoons even when the sun is high and the sky is clear.
Which panels fare better? Monocrystalline panels typically carry coefficients between −0.29%/°C and −0.35%/°C. Thin-film panels can range from −0.20%/°C to −0.30%/°C, making them less heat-sensitive but generally less efficient overall. The difference between a −0.29%/°C panel and a −0.35%/°C panel at 65°C is roughly 2.4% production — small per panel, but meaningful on a 10 kW system over a 20-year lifespan.
Symptom: Production Drops on Hot, Sunny Afternoons
What you see: Your monitoring app shows midday production rising through the morning, then leveling off or dropping slightly between 1 and 4 PM — even when the sun is unobstructed and conditions look perfect. Morning production may exceed midday output on the hottest days.
What causes it: As panel temperature climbs past roughly 45°C, efficiency loss begins to outweigh the gains from stronger sunlight. Your panels are producing a rolling tradeoff: more irradiance versus more heat. By mid-afternoon, heat wins. The effect compounds on days with high ambient temperature, low wind, and minimal cloud cover — conditions that let the panel absorb heat without any way to shed it.
What to check first: Look at your monitoring data for panel-level or string-level output, not just system total. If the drop is consistent across all panels, it is heat-related. If only one string drops, you have a separate issue worth investigating.
The Fix: How Much Can You Recover?
Ventilation and mounting gap. Panels mounted with a 4–6 inch gap between the module and the roof surface allow air to circulate underneath, carrying heat away. Flush-mounted systems — panels sitting nearly against the roof — run measurably hotter. If you are designing a new system, choose rails that maintain that airflow gap. If your system is already installed with tight clearance, there is little you can practically change without a re-mount, but it is worth knowing what your baseline is.
Color of the roofing material. A dark asphalt shingle roof underneath panels radiates retained heat back up toward the modules. Light-colored roofs or metal roofs with reflective coatings keep the under-panel air cooler. This effect is modest — a few degrees of panel temperature — but it compounds with every hot afternoon over the life of the system.
Panel tilt and ground-mounted options. A ground-mounted system with a steeper tilt in summer sheds heat more effectively than a low-tilt roof array, because airflow reaches both the front and back surfaces. Roof-mounted systems are limited by roof geometry; ground mounts have more flexibility on tilt angle and spacing. Production differences from heat alone rarely justify the higher ground-mount cost, but if you are already comparing mounting options, heat performance is a valid input to that decision.
The one thing that does not help: adding more panels. Oversizing a system to compensate for heat losses raises your peak production on mild days, but the heat loss percentage is the same regardless of system size. You do not fix a temperature coefficient problem by scaling the system — you just scale the loss along with everything else.
Symptom: Power Decline Over Multiple Consecutive Hot Days
What you see: Your system’s daily production drops steadily across a multi-day heat wave — not just during peak afternoon hours, but for the entire day by day three or four.
What causes it: Sustained high ambient temperatures keep panels hot around the clock. Panels cool off at night, but on a string of 30°C+ nights with no wind, overnight cooling is incomplete. Each morning, the panels start warmer than they did the day before, and peak temperature creeps higher each afternoon. The result is a rolling loss that accumulates until the heat wave breaks.
What to check first: If your electricity usage also climbs during the heat wave (air conditioning), your net metering credits shrink from both directions — lower production and higher consumption. Check your utility usage and your production data together, not in isolation.
The Fix: Understanding What Is and Is Not Degradable
Degradation rate matters more than daily temperature loss. All solar panels degrade — their output declines a small percentage each year. The standard warranty rate is 0.5–0.7% per year. High heat accelerates this long-term degradation, but only mildly in practice. A panel on a 45°C-roof climate degrades somewhat faster than the same panel on a 20°C-climate roof, but both stay within the warranty’s output guarantee. The bigger risk is manufacturing defects that heat stress exposes, which you need the warranty to cover — not panel replacement costs you absorb yourself.
PID (Potential-Induced Degradation) is a heat-related failure mode. In humid, hot conditions, voltage leakage through the panel’s glass can degrade output permanently. Better-quality panels include PID-resistant materials, and most modern panels handle this adequately. If you have older panels or budget-tier modules from a decade ago, this deserves attention.
Hot spot and bypass diode failures surface during heat waves. When one cell fails or gets shaded (bird droppings, leaf buildup), it resists current flow and heats up well beyond normal operating temperature. Sustained heat can damage that cell permanently, and eventually open the bypass diode that protects the string. If you see a persistent production drop in one string during a heat wave, inspect that string for shading or soiling before assuming it is ambient temperature.
Symptom: Production Never Recovers After a Heat Wave
What you see: After the heat breaks and ambient temperatures return to normal, production does not fully bounce back to pre-heat-wave levels. The gap is small — a few percent — but it persists.
What causes it: This is the signature of permanent damage or accelerated degradation — a burned hot spot, a failed bypass diode, or, more rarely, microcracks in the silicon cells that developed under thermal stress. Thermal cycling — panels expanding in midday heat and contracting at night — is the most common mechanical stressor in panel degradation. Heat waves multiply the number and severity of those cycles.
What to check first: Look at your monitoring app’s per-panel or per-string output over a full day. A consistent loss across the whole system suggests general degradation. A loss in one string only points to a failed diode or a damaged panel in that string. Infrared imaging (which you can hire an inspector to do) reveals hot spots that are not visible to the naked eye.
The Fix: What You Can and Cannot Do About Heat Damage
For a failed bypass diode: This is a replaceable component, but it requires opening the panel junction box — a job for a qualified technician, and one that may void your panel warranty. Check your warranty terms before proceeding.
For a burned hot spot or microcrack: Panel replacement is the realistic fix. A panel with permanent cell damage continues to lose output slowly, and the damaged cell keeps underperforming relative to its neighbors. Replacement cost has dropped to roughly $150–$300 per panel for most common residential modules, and a damaged panel dragging down a string reduces the entire string’s output, so replacement can recover more than just that panel’s own loss.
For general degradation: This is normal wear. The panel warranty guarantees a minimum output floor — commonly 84–90% after 25 years. If your panels measure below the warranty floor, the manufacturer must replace them. Document your production data carefully and file a claim if you cross that threshold.
Practical Heat Management Checklist for Homeowners
| Item | What to Do | Frequency |
|---|---|---|
| Monitor mid-afternoon production | Check for unusual drops vs. clear-sky expectations | Weekly during heat season |
| Inspect for shading or soiling | Look for buildup that creates hot spots | Monthly, and after storms |
| Confirm airflow gap under panels | Measure with a flashlight if needed — should be 4–6 inches | Once, at purchase/installation |
| Track multi-day heat-wave production | Compare your heat-wave totals to a mild-week baseline | During each extended heat event |
| Check for string-level discrepancies | Compare output across strings in your monitoring app | Monthly |
| Review warranty degradation terms | Know your panel’s guaranteed output floor | Annually |
When Heat Performance Should Change Your Purchase Decision
Alone, temperature coefficient should not dominate a panel choice — efficiency, price per watt, and warranty terms carry more weight. But if you are comparing two panels that are otherwise close in cost and output, the lower temperature coefficient is the tiebreaker that keeps producing value for the entire system life. That difference compounds.
The more consequential heat-related decision is mounting. A ground-mounted array with good airflow can produce several percent more than an equivalent flush-roof system on the hottest weeks of the year. That gap shrinks for the rest of the year, but it reoccurs every summer. If you live in a climate where heat waves run for weeks or months, that recurring summer differential is worth including in the cost comparison between mounting options.
Have you noticed a production dip on your hottest days, or are you comparing panels and wondering how much the temperature coefficient matters for your specific climate? Share your system size, your region’s typical summer highs, and what your monitoring data shows — that combination is enough to start mapping your system’s heat response.
Related guides: Why Your Solar Panels Underproduce in Summer: Troubleshooting Common Output Problems, Combining Solar With Heat Pumps: What Homeowners Should Know, and Solar Panel Permits and HOA Restrictions: What to Know Before You Apply.
🔗 Recommended Reading
- Solar Incentive Paperwork: Common Filing Mistakes That Delay Your Rebate
- Home Battery Sizing Mistakes That Lead to Blackout Regret
- Common Solar Installer Mistakes Homeowners Should Catch Before Signing
- Common Home Battery Storage Wiring and Placement Mistakes to Avoid
- Solar Payback Period vs Cash-on-Cash Return: Which Metric Should Homeowners Use