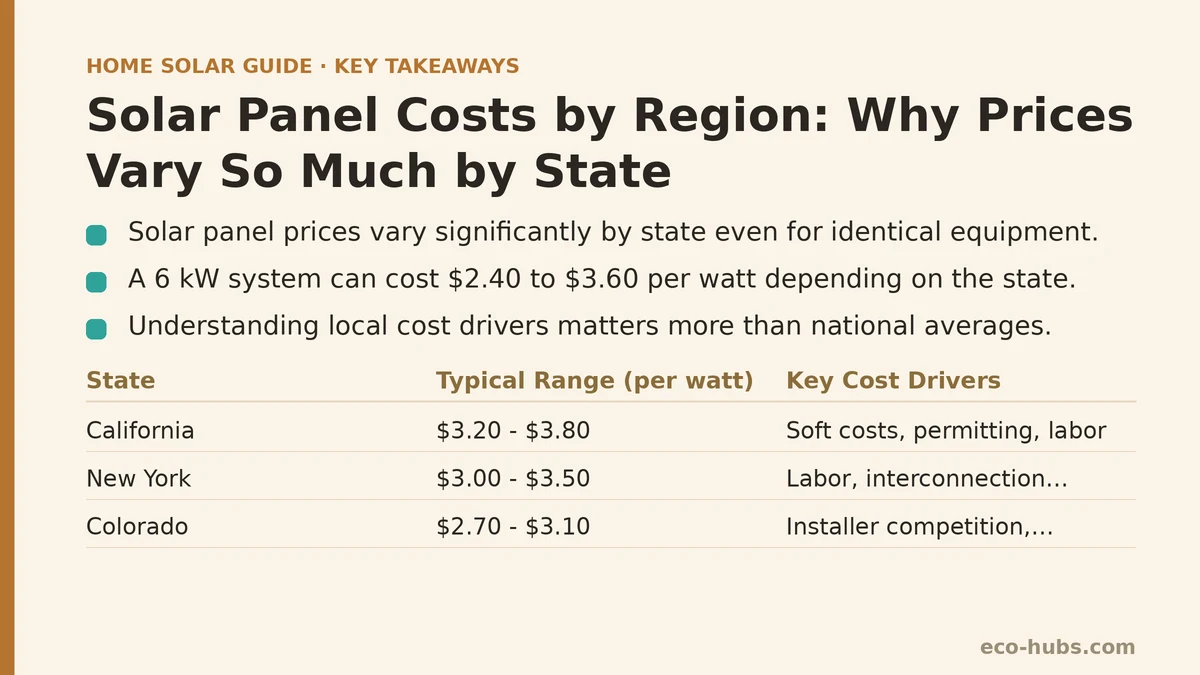
Many homeowners assume the price of solar panels is roughly the same everywhere — the equipment is manufactured globally, so the hardware cost must be similar. That assumption collapses the moment you compare quotes across state lines. A 6 kW system might price out at $2.40 per watt in one state and $3.60 per watt in another, a difference of thousands of dollars for identical equipment. Neither number is necessarily a rip-off; each reflects a distinct combination of labor rates, permitting friction, installer competition, and soft costs that vary more than the hardware itself. Understanding which forces are driving the price in your specific state matters more than chasing a national average.
To make this concrete, here are five representative states ranked by typical installed cost per watt for a residential system. The ranking runs from most expensive to least expensive, and each entry breaks down the specific cost drivers at play.
1. California — The Soft-Cost Ceiling
Typical range: $3.20 – $3.80 per watt
You might expect the largest solar market in the country to have the lowest prices from sheer volume. In practice, California consistently lands near the top of the cost spectrum. Equipment prices are competitive, but soft costs dominate. Permitting requirements vary by city and county, and some jurisdictions require structural engineering stamps, fire department approvals, and electrical plans that add weeks of labor and hundreds of dollars in fees. The state’s high labor rates for licensed electricians and roofers push installation labor higher than nearly anywhere else. Installer overhead — insurance, workers’ compensation, local business licenses — also runs steep.
The state’s shift to net billing under NEM 3.0 has squeezed installer margins, and some companies have responded by raising per-watt prices on smaller systems to maintain profitability. If you are comparing quotes in California, the variance between installers can be wide, but the floor itself is high due to structural costs that no installer can avoid.
2. New York — Labor and Interconnection Friction
Typical range: $3.00 – $3.50 per watt
New York’s prices are driven less by raw permitting costs and more by labor rates and utility interconnection timelines. The state has strong prevailing-wage pressures in certain regions, and unionized electrical labor is common in the downstate area. That pushes the installation labor line item up measurably compared to states with more flexible labor markets. Interconnection applications through some New York utilities also require detailed engineering reviews that can stretch for months, and installers price that carrying cost into their quotes.
The state’s solar incentives, including the NY-Sun program, reduce the net cost to the homeowner, but the gross price before incentives still reflects the high labor and administrative burden. A homeowner in rural upstate New York will typically see quotes near the lower end of that range, while a Long Island or Westchester County address will trend toward the top.
3. Colorado — Middle Ground with Notable Exceptions
Typical range: $2.70 – $3.10 per watt
Colorado sits in the middle of the national spectrum, but the spread within the state is wider than the range suggests. The Denver metro area benefits from a dense concentration of installers competing for business, which keeps quotes competitive. Permitting is relatively streamlined in most Front Range jurisdictions, and interconnection through Xcel Energy is a well-worn path that most local installers have navigated many times over.
The exceptions are rural and mountain communities. Counties with small permitting offices and limited solar history can add review time and, in some cases, require structural reviews that urban jurisdictions skip. Travel time for installation crews also adds labor hours when the job site is two hours from the installer’s base. If you live in a mountain town, expect quotes that run closer to the national average than the Denver metro norm.
4. Texas — Competitive Market, Uneven Soft Costs
Typical range: $2.40 – $2.90 per watt
Texas benefits from strong installer competition in its major metropolitan areas — Houston, Dallas, Austin, and San Antonio all have many active solar companies competing on price. Equipment costs are comparable to other states, but labor is cheaper than the coasts, and most jurisdictions have light-touch permitting processes. Interconnection through most Texas utilities is about as straightforward as it gets, adding little to the timeline or the price.
The uneven part is the exceptions. Some municipalities have adopted local permitting requirements that add friction, and rural areas serviced by electric cooperatives can face different interconnection rules than the big investor-owned utilities. The range reflects those pockets of increased complexity. For a homeowner in a major metro, the lower end of the range is realistic; rural addresses will often land near the top.
5. Florida — The Low-Cost Exception
Typical range: $2.20 – $2.60 per watt
Florida consistently posts some of the lowest installed costs per watt in the country, and the reasons are structural rather than a result of poor-quality work. The state has a high volume of installations, particularly in the central and southern regions, which allows installers to buy equipment in larger quantities and schedule crews with minimal downtime. Labor rates for solar installation work are lower than the Northeast and West Coast, drawing on a workforce that is both available and efficient.
Permitting in most Florida counties is a straightforward and fast process, and the state’s net metering rules have historically been favorable, which has kept demand steady and installers operating at scale. One important caveat: homeowners in Florida should scrutinize whether the low price includes proper roof penetration sealing and wind-rated mounting, since the state’s hurricane exposure demands higher engineering standards than inland states. A cheap quote that skips those details is not a bargain.
Why the Same Panels Cost Different Amounts Across State Lines
The hardware — panels, inverters, racking, and wiring — represents a shrinking share of the total price difference between states. A 400-watt panel from the same manufacturer costs roughly the same whether it is installed in Fresno or Fort Lauderdale. The divergence comes from four categories of soft costs:
| Cost Driver | Impact on Price | Where It Hits Hardest |
|---|---|---|
| Labor rates | 15–30% of total price | California, New York |
| Permitting and inspection fees | 3–10% of total price | California, some New Jersey and Massachusetts jurisdictions |
| Interconnection delays and utility requirements | Adds to installer overhead, raises quote | New York, parts of the Midwest |
| Installer competition and market maturity | Keeps prices lower in dense markets | Texas metro areas, Florida, Colorado Front Range |
The same system priced at $2.40 per watt in Florida would carry a $14,400 price tag for 6 kW. That same system in California at $3.50 per watt jumps to $21,000 — a $6,600 gap on identical equipment. The homeowner in the high-cost state is not being overcharged; the price reflects the actual cost of doing business in that region. The tradeoff, however, is that roof suitability, self-consumption rules, and net metering rates vary alongside those costs. A cheaper installation in a state with poor net metering can cost more over the system’s lifetime than a pricier installation where the utility pays fair rates for exported power.
Regional Price Research Checklist
Use this short checklist to sharpen your regional comparison before requesting quotes:
- Check your state’s average cost per watt on a recent industry report, but treat the number as a starting range, not a firm expectation.
- Ask each installer for a line-item breakdown separating equipment, labor, permitting, and interconnection fees. The ratio between labor and equipment tells you which soft costs dominate locally.
- Look up your specific utility’s interconnection requirements in advance. A utility with a complicated application process will push installer quotes higher.
- Confirm whether your jurisdiction requires a structural engineering review. Some counties do, some do not, and the difference can add $500 to $1,500 to the quote.
- Consider your roof’s pitch, height, and material. A steep or complex roof adds labor hours regardless of the state average.
What This Means for Your Quote
The regional cost table gives you context, but your local quote will still be shaped by factors specific to your property — roof condition, shading, panel count, and the installer’s current workload. A California quote on the lower end of the range may be more reasonable than a Florida quote on the upper end of that state’s range, once you account for what each price includes. The goal is not to hit the national average; it is to find an installer whose itemized costs are defensible for your specific region and roof.
Which state’s pricing surprised you most, and how does the typical cost per watt in your area compare to the range you expected? If you have a quote in hand, describe the line items you are seeing and we can assess whether the regional factors above explain the gap.
Related guides: The Real Cost of Residential Solar Panels in 2026, Common Solar Panel Problems: A Myth vs. Reality Troubleshooting Guide, and Community Solar Programs Explained: 5 Program Types Ranked by How Much They Actually Deliver.
🔗 Recommended Reading
- Solar Incentive Paperwork: Common Filing Mistakes That Delay Your Rebate
- Home Battery Sizing Mistakes That Lead to Blackout Regret
- Common Solar Installer Mistakes Homeowners Should Catch Before Signing
- Common Home Battery Storage Wiring and Placement Mistakes to Avoid
- Solar Payback Period vs Cash-on-Cash Return: Which Metric Should Homeowners Use