A common misconception is that the brand name printed on a solar panel determines how well that panel performs. In practice, brand reputation matters far less than the specific model, its efficiency rating, its degradation rate, and the warranty attached to it. Two panels from the same brand can differ meaningfully in output and longevity, and two different brands can produce panels that are nearly identical on paper. What follows is a specification-focused comparison of the major residential panel brands, organized so that a first-time buyer and a more experienced evaluator can each take something useful from it.
How to Read a Panel Specification Sheet
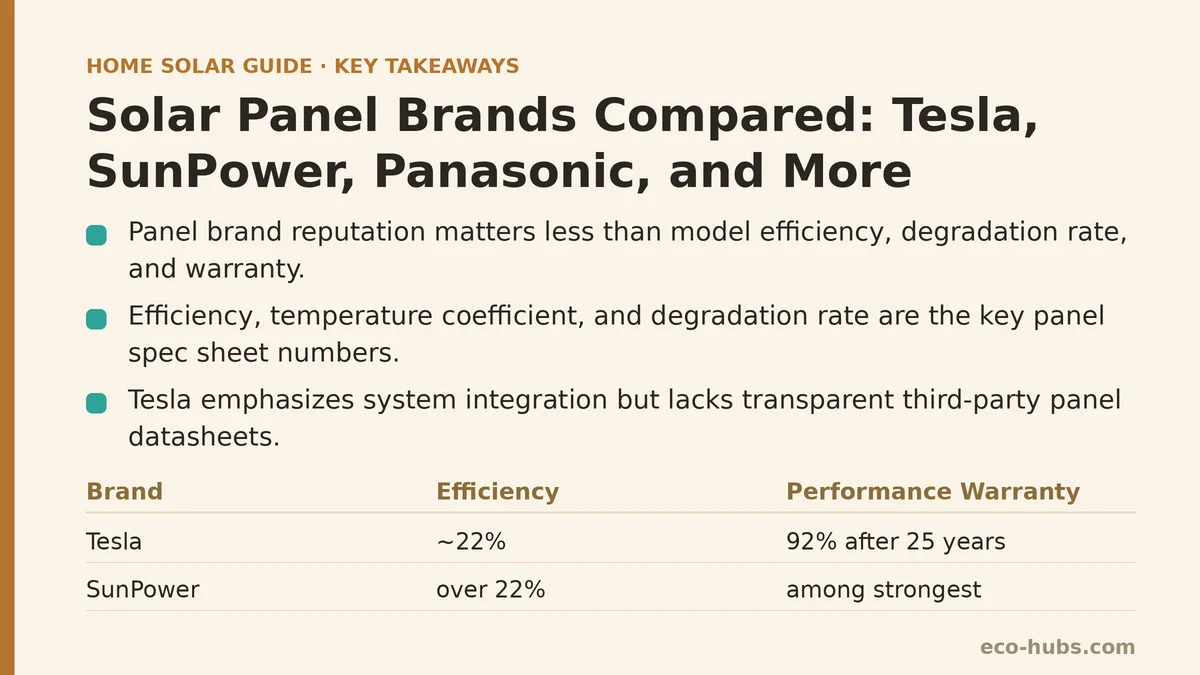
Before comparing brands, it helps to understand the three numbers that dominate every panel datasheet: efficiency, temperature coefficient, and degradation rate.
Efficiency tells you what percentage of sunlight hitting the panel becomes electricity. A panel at 22% efficiency produces more power per square foot than one at 19%, which matters most when roof space is limited. Temperature coefficient describes how much output drops as the panel heats up; a coefficient of -0.30%/°C means less power loss on hot days than one at -0.40%/°C. Degradation rate is the annual percentage of output lost over time; a panel degrading at 0.25% per year retains more of its original output after 25 years than one degrading at 0.50% per year.
For a beginner, these three numbers alone capture most of what separates one premium panel from another. For an advanced buyer, additional factors matter: cell technology (PERC, TOPCon, or HJT), warranty terms for both product and performance, and whether the panel uses a half-cut cell design that improves shade tolerance. The comparison tables below fold all of these into one place.
Tesla: The Integrated System Play
Tesla does not publish the same detailed panel datasheets that traditional manufacturers provide, and that omission is itself worth noting. The company offers a 425W panel with an efficiency rating around 22%, which places it in the upper tier of residential panels. What Tesla emphasizes instead is the full-system integration: their panels are designed to pair with the Tesla Gateway and Powerwall battery, and the whole package is managed through a single app interface.
The measurable tradeoff appears in the warranty. Tesla’s product warranty covers 25 years, which matches the industry standard, and their performance warranty guarantees 92% of rated output after 25 years — slightly weaker than the top-tier guarantee from SunPower or Panasonic. For a beginner who values simplicity and already plans to add battery storage, Tesla’s ecosystem advantage can outweigh the slightly weaker performance guarantee. For an advanced buyer comparing panels in isolation, the lack of transparent third-party datasheets makes direct spec-by-spec comparison more difficult.
| Specification | Tesla 425W (HHC) |
|---|---|
| Efficiency | ~22% |
| Temperature coefficient | Not publicly specified |
| Degradation rate | Not publicly specified |
| Product warranty | 25 years |
| Performance warranty | 92% output after 25 years |
| Cell technology | Half-cut |
| Best fit | Integrated systems with Powerwall |
SunPower: The Premium Efficiency Leader
SunPower, now operating under the Maxeon brand for its highest-tier panels, has held the residential efficiency crown for years. Their current flagship produces over 22% efficiency, and their warranty package is among the strongest in the industry: 25-year product and performance warranties with a guarantee of 92% output after 25 years, backed by a company with a longer track record than most newer entrants.
The price premium is real, typically landing 15–30% above comparable panels from other brands. That premium buys measurable performance: higher efficiency per square foot, a lower degradation rate than most competitors, and a warranty that covers labor in addition to parts in many cases. For a homeowner with limited roof space or heavy shading where every square foot of panel area matters, SunPower’s efficiency advantage can recover its higher upfront cost through greater lifetime production.
An advanced buyer might note that SunPower’s performance advantage over other top-tier brands has narrowed slightly in recent years as competitors improved their own cell technology. The gap between SunPower and Panasonic, for instance, is now closer than it was five years ago. The distinction has shifted from clear dominance to a slim but consistent edge.
| Specification | SunPower Maxeon 6 (440W) |
|---|---|
| Efficiency | 22.8% |
| Temperature coefficient | -0.29%/°C |
| Degradation rate | 0.25% per year |
| Product warranty | 25 years |
| Performance warranty | 92% after 25 years |
| Cell technology | IBC (Interdigitated Back Contact) |
| Best fit | Limited roof space, maximum efficiency priority |
Panasonic: The Balanced All-Rounder
Panasonic’s EverVolt series occupies the sweet spot between premium performance and reasonable pricing. Their current panels achieve around 21.5–22% efficiency, slightly below SunPower’s top tier but above most mainstream offerings. The temperature coefficient is strong at -0.26%/°C, meaning the Panasonic panels lose less output on hot days than most competitors, which matters for homeowners in warm climates.
The warranty terms match SunPower’s structure: 25 years on both product and performance, with a 92% output guarantee. Panasonic’s degradation rate of 0.25% per year is also in the same class as top competitors. The real distinction is price — Panasonic typically undercuts SunPower by 10–20% while delivering specifications that are close enough that many homeowners cannot tell the difference in real-world output.
The one notable caution is distribution. Panasonic panels are not available through every installer, and some regions have limited access. Checking whether a local installer can source them before falling in love with the spec sheet is a practical step worth taking.
| Specification | Panasonic EverVolt (425W) |
|---|---|
| Efficiency | 21.6% |
| Temperature coefficient | -0.26%/°C |
| Degradation rate | 0.25% per year |
| Product warranty | 25 years |
| Performance warranty | 92% after 25 years |
| Cell technology | TOPCon (N-type) |
| Best fit | Hot climates, balanced price-performance |
REC Group: The Emerging Value Leader
REC Group has built a strong reputation among installers even though their name recognition among homeowners lags the big three. Their Alpha series panels achieve around 21.5–22% efficiency, and their degradation rate of 0.25% per year matches the premium tier. The headline differentiator is the warranty: REC offers a 25-year product warranty that also covers labor, plus a 25-year performance warranty guaranteeing 92% output.
What makes REC a value leader is pricing. They typically land between the mainstream brands and the premium tier, delivering specifications close to Panasonic and SunPower at a price closer to LG or Q CELLS. The tradeoff is a shorter track record in the residential market compared to the older brands, though REC has been manufacturing solar panels since 1996.
| Specification | REC Alpha Pure-R (430W) |
|---|---|
| Efficiency | 22.3% |
| Temperature coefficient | -0.26%/°C |
| Degradation rate | 0.25% per year |
| Product warranty | 25 years (incl. labor) |
| Performance warranty | 92% after 25 years |
| Cell technology | Heterojunction (HJT) |
| Best fit | Value-seeking buyers wanting premium specs |
Q CELLS: The Mainstream Benchmark
Q CELLS is the brand most homeowners encounter when they receive quotes from multiple installers, and for good reason: their panels combine reasonable efficiency with aggressive pricing and broad installer availability. Their current Q.TRON series achieves around 20.5–21% efficiency, below the premium tier but consistent and reliable.
The warranty structure is slightly weaker than the premium brands: 25 years on product and performance, with a performance guarantee of 87% output after 25 years. That is five percentage points lower than SunPower, Panasonic, or REC after the same period. Over a 25-year lifespan, this difference can translate into several thousand dollars of reduced lifetime production depending on system size and electricity rates.
For a beginner budget-focused buyer, Q CELLS represents the sensible default — solid performance at the lowest price per watt among the major brands. An advanced buyer comparing a Q CELLS quote against a premium brand needs to run the lifetime production math rather than comparing sticker prices, because the warranty gap narrows the cost difference substantially over time.
| Specification | Q CELLS Q.TRON (405W) |
|---|---|
| Efficiency | 20.9% |
| Temperature coefficient | -0.30%/°C |
| Degradation rate | 0.40% per year |
| Product warranty | 25 years |
| Performance warranty | 87% after 25 years |
| Cell technology | TOPCon (N-type) |
| Best fit | Budget-conscious beginners, large roof areas |
The Advanced Buyer’s Additional Considerations
For those comparing panels beyond the spec sheet, two additional variables matter. First, panel aesthetics: Tesla’s all-black panels, SunPower’s seamless mounting hardware, and REC’s near-invisible busbars all address homeowners who care about roof appearance. Second, string inverter compatibility: some premium panels with built-in microinverter integrations (notably from Enphase with their own panels) change the system architecture and affect inverter sizing decisions.
Another advanced consideration is panel sizing flexibility. If your roof has odd dimensions or unusual angles, panels that offer multiple size variants within the same series can simplify the layout design and reduce waste. SunPower and Q CELLS both offer a broader range of sizes within their current product lines than Tesla or Panasonic.
Comparison at a Glance
| Brand | Efficiency | Degradation (annual) | Performance Warranty (25-yr) | Relative Price | Best For |
|---|---|---|---|---|---|
| Tesla | ~22% | Not specified | 92% | Mid | Integrated systems, battery pairing |
| SunPower | 22.8% | 0.25% | 92% | Premium | Limited roof space, max efficiency |
| Panasonic | 21.6% | 0.25% | 92% | Mid-high | Hot climates, balanced specs |
| REC | 22.3% | 0.25% | 92% | Mid | Value with premium specs |
| Q CELLS | 20.9% | 0.40% | 87% | Budget | Large roofs, budget priority |
The Real-World Output Calculation That Decides the Difference
The gap between a 0.25% and 0.40% annual degradation rate sounds small until it is compounded over two decades. On a 6 kW system generating roughly 8,000 kWh in year one, a panel degrading at 0.25% per year produces about 7,520 kWh in year 25. The same system with a 0.40% degradation rate produces about 7,230 kWh in year 25. That difference of roughly 300 kWh per year in the final years of the system, at a typical residential rate of $0.15/kWh, amounts to roughly $45 annually near the end of the system’s life.
Also worth factoring in is the temperature coefficient if you live in a hot climate. A panel with a -0.26%/°C versus -0.30%/°C coefficient on a day where the panel reaches 65°C above standard test conditions loses 15 watts less at peak output. On a hot summer afternoon, that is the difference between a system producing at 87% of its rated output versus 84%. These small advantages compound across every sunny day the system operates.
Which Brand Makes Sense for Your Situation
A beginner comparing quotes should first confirm that all quotes are based on comparable roof coverage and system size, then compare the three headline numbers — efficiency, degradation, and warranty output guarantee — before looking at brand names. A quote that saves $2,000 upfront but uses panels with a weaker 25-year output guarantee often costs more over the system’s lifetime.
An advanced buyer should push installers for the full spec sheets and verify the measured temperature coefficient and degradation rate rather than the marketing summaries. The differences between premium brands are now small enough that panel selection often comes down to installer availability, local storage requirements, and aesthetic preference.
Which of the five brands above have shown up in your current quotes or installer recommendations, and what roof constraint — limited square footage, hot climate, or budget ceiling — is most relevant for your situation? Describe your specific tradeoff and I can help you calculate which brand’s numbers dominate for your case.
Related guides: Solar Panel Maintenance: What to Actually Expect Over Time, Off-Grid Solar System Design: The Right Order of Decisions, and Solar Panels and Homeowners Insurance: What You Need to Know.
🔗 Recommended Reading
- Solar Incentive Paperwork: Common Filing Mistakes That Delay Your Rebate
- Home Battery Sizing Mistakes That Lead to Blackout Regret
- Common Solar Installer Mistakes Homeowners Should Catch Before Signing
- Common Home Battery Storage Wiring and Placement Mistakes to Avoid
- Solar Payback Period vs Cash-on-Cash Return: Which Metric Should Homeowners Use