Say you are sitting across from a client who has just received three solar quotes, and they want you to tell them whether the investment makes sense. The quotes range from $18,000 to $31,000 for what sounds like similar system sizes. One installer projects a 6-year payback. Another says 11 years. The client wants a single answer, and you need to give them something defensible rather than a number pulled from whichever proposal has the most optimistic assumptions baked in.
This guide walks through the scenarios that most often produce bad ROI math, what causes each one, and how to correct it. Think of it as a troubleshooting checklist you can run against any client’s proposal before you sign off on the numbers.
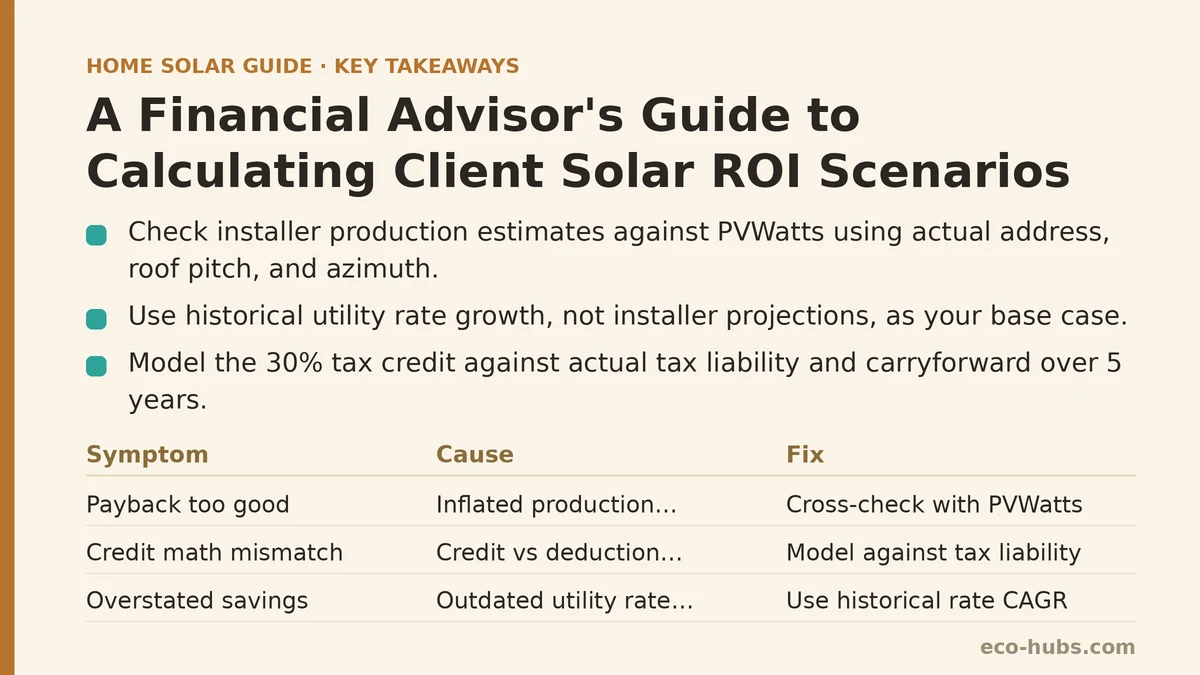
Symptom: The Payback Period Looks Too Good
Cause: Inflated production estimates or outdated utility rates
When an installer projects a 5- or 6-year payback on a system in a moderate-sun region, the first thing to check is the production estimate. Production figures are typically modeled using tools like PVWatts or Aurora, and small assumption changes (shading, panel orientation, degradation rate) can shift the output by 15-30%. An installer motivated to close a sale may model ideal conditions rather than the client’s specific roof.
The second culprit is the utility rate. Solar savings depend on what you would have paid the utility otherwise. If the proposal assumes a rate escalation of 5% per year when the local utility has averaged 2.5% over the past decade, the long-term savings are overstated.
Fix: Rebuild the production estimate independently
Ask the client to share the installer’s production model, then cross-check the annual kilowatt-hour figure against PVWatts (free, from NREL) using the client’s actual address, roof pitch, and azimuth. A common rule of thumb: a well-oriented, unshaded system in most U.S. climates produces roughly 1,200-1,600 kWh per installed kW per year, with wide regional variation. If the proposal exceeds that range, ask why.
For utility rates, pull the last 10 years of the local utility’s residential rate history and calculate the actual compound annual growth rate. Use that historical figure, not the installer’s projection, as your base case.
Symptom: The Client’s Tax Credit Math Does Not Match Their Tax Liability
Cause: Confusing a credit with a deduction, or ignoring the carryforward rules
The federal residential clean energy credit covers 30% of qualified costs, including equipment and installation labor. Clients frequently hear “30% off” and assume they receive a check. In practice, the credit is nonrefundable — it reduces tax owed dollar for dollar, but any excess carries forward to future tax years.
For a client with a $6,000 annual federal tax liability and a $9,000 credit, they will use $6,000 in year one and carry the remaining $3,000 forward. If the client is retired, has significant deductions, or has low taxable income, the credit may take several years to fully monetize.
Fix: Model the credit against actual tax liability
Build a simple year-by-year table showing the client’s projected federal tax liability against the remaining credit balance. If the credit is not fully used within 5 years in your base case, that delay erodes the effective ROI. For clients on the edge, a partial-year monetization is common and should be modeled honestly rather than assumed away.
Symptom: Two Quotes With Similar System Sizes Show Wildly Different Paybacks
Cause: Different financing structures, adders, or equipment tiers
A cash price of $22,000 and a financed price of $31,000 for the same system often get compared as if they are the same deal. They are not. Solar loans frequently include dealer fees of 15-25% baked into the principal, and the loan’s APR adds interest cost on top.
The other common variable is equipment tier. A quote using premium panels and a string inverter versus one using standard panels and microinverters can differ by $3,000-6,000 for the same wattage, with production differences typically in the low single-digit percentages.
Fix: Normalize to a common basis before comparing
Put all quotes on a cash-equivalent basis by asking each installer for the cash price alongside the financed price. If the client intends to finance, model the actual loan terms (APR, term length, dealer fee) separately from the system cost. This usually reveals that the “cheaper” financed quote costs more over the loan term than the “more expensive” cash quote financed through a credit union.
For equipment, ask for the specific panel and inverter models and their warranties. Differences in production rarely justify a large price gap for residential systems, but warranty terms and degradation rates can matter over 25 years.
Symptom: The Client Is Comparing Solar to a Stock Portfolio
Cause: Category confusion between a consumption offset and an investment
Solar does not produce cash returns the way a bond or dividend stock does. It offsets an expense the client would otherwise pay. The correct comparison is not “solar versus the S&P 500” but “solar versus paying the utility for the next 25 years.” That said, the client may still want to know the implied internal rate of return (IRR) of the solar purchase, which is a reasonable ask.
Fix: Build an IRR from the avoided-cost stream
The IRR of a solar system is the discount rate at which the present value of avoided utility bills equals the net upfront cost (after tax credit). For a typical residential system with a 25-year life, this IRR commonly lands in the 6-12% range, varying heavily by region, utility rate, and net metering policy.
Run the math in a spreadsheet: Year 0 outflow is the net cost after tax credit; Years 1-25 inflows are the annual avoided utility cost, escalated at your realistic utility rate assumption; include an inverter replacement around year 12-15 as a $1,500-2,500 outflow. The result is a defensible number you can compare to the client’s other options, with the caveat that it is not liquid and not diversified.
Symptom: The Client’s ROI Depends on Net Metering That May Change
Cause: Policy risk baked into a 25-year projection
Many payback calculations assume net metering continues unchanged for the life of the system. In practice, several states have revised or replaced net metering in the past five years, moving toward lower export compensation or time-of-use structures. A system that pays back in 8 years under full net metering might take 12-14 under a reduced export rate.
Fix: Run a policy-sensitivity scenario
Build at least three scenarios: current net metering preserved, moderate reduction (export credit cut by roughly half), and severe reduction (export credit near wholesale rate). Present all three to the client. If the system still makes sense under the moderate scenario, the risk is likely acceptable. If it only works under the current policy, the client is taking uncompensated policy risk.
Pair this with a discussion of whether the client can shift usage to maximize self-consumption (running appliances during solar production hours), which reduces exposure to net metering changes. For clients considering a battery, model whether the battery’s added cost is justified by the policy hedge or backup power value, rather than by export arbitrage alone.
Symptom: The Client’s Roof or Electrical Panel Adds Hidden Costs
Cause: Quoted price excludes required upgrades
Solar quotes sometimes omit necessary work: roof replacement if shingles are near end of life, main panel upgrade if the existing panel cannot handle the solar backfeed, or structural reinforcement for older roofs. These adders commonly run $2,000-8,000 combined.
Fix: Get these costs on the table before signing
Ask the installer to confirm in writing whether the quote includes any needed panel or roof work, and if not, what the anticipated cost would be. If the roof is within 5 years of needing replacement, replacing it before solar installation is usually the better sequence, since removing and reinstalling panels later adds cost and complexity.
Quick Reference: Scenario Builder
| Scenario Element | Base Case Assumption | Stress Case Adjustment |
|---|---|---|
| Production estimate | Independent PVWatts model | Reduce 10% for shading/soiling |
| Utility rate escalation | Last 10-year historical CAGR | Freeze at current rate |
| Federal tax credit monetization | Used within 2 years | Spread over 4-5 years |
| Net metering | Current policy preserved | Export credit cut by half |
| Inverter replacement | Year 13, $2,000 | Year 10, $2,500 |
| Roof/panel adders | Included in quote | Add $5,000 for contingency |
If the system still shows a reasonable IRR in the stress case, the client has a defensible investment. If it only works in the base case, the case is thinner than the installer’s proposal suggests.
What to Do Next
Start by requesting the installer’s production model and a line-item breakdown of the quote, including any contingencies. Rebuild the production estimate independently using PVWatts at the client’s address. Pull the utility’s historical rate data and calculate a realistic escalation figure. Then run the three-scenario stress test above. If the client is comfortable with the moderate scenario outcome, they have a reasonable basis to proceed. If not, ask whether a smaller system, a battery for self-consumption, or waiting for the roof replacement cycle makes more sense. And remember: this is general framework guidance, not personalized financial advice — always confirm current incentive rules, tax treatment, and local utility policy with a licensed tax professional and the relevant program administrators before advising a client to sign.
If you are working through a specific client scenario and want to pressure-test the assumptions, describe the system size, region, and financing structure, and we can walk through which parts of the model are most likely to be off.
Related guides: Solar and Battery Storage for Financial Advisors: What Clients Should Know, State-by-State Solar Incentives and Rebates: A Complete Guide, and Comparing Solar Quotes: What the Numbers Mean.
🔗 Recommended Reading
- Common Solar Installer Mistakes Homeowners Should Catch Before Signing
- Common Home Battery Storage Wiring and Placement Mistakes to Avoid
- Solar Payback Period vs Cash-on-Cash Return: Which Metric Should Homeowners Use
- Net Metering Credit Rollover Rules: What Happens at Year End
- Mistakes Homeowners Make When Sizing a Home Battery Bank