Two installers can quote the same roof, the same equipment tier, and the same system size, yet the dollar figures can differ by more than 20 percent. The lower quote is not automatically the better deal, and the higher quote is not automatically padding its profit. In practice, the difference sits in the details of what each number measures and what the installer chose to include or exclude from the price.
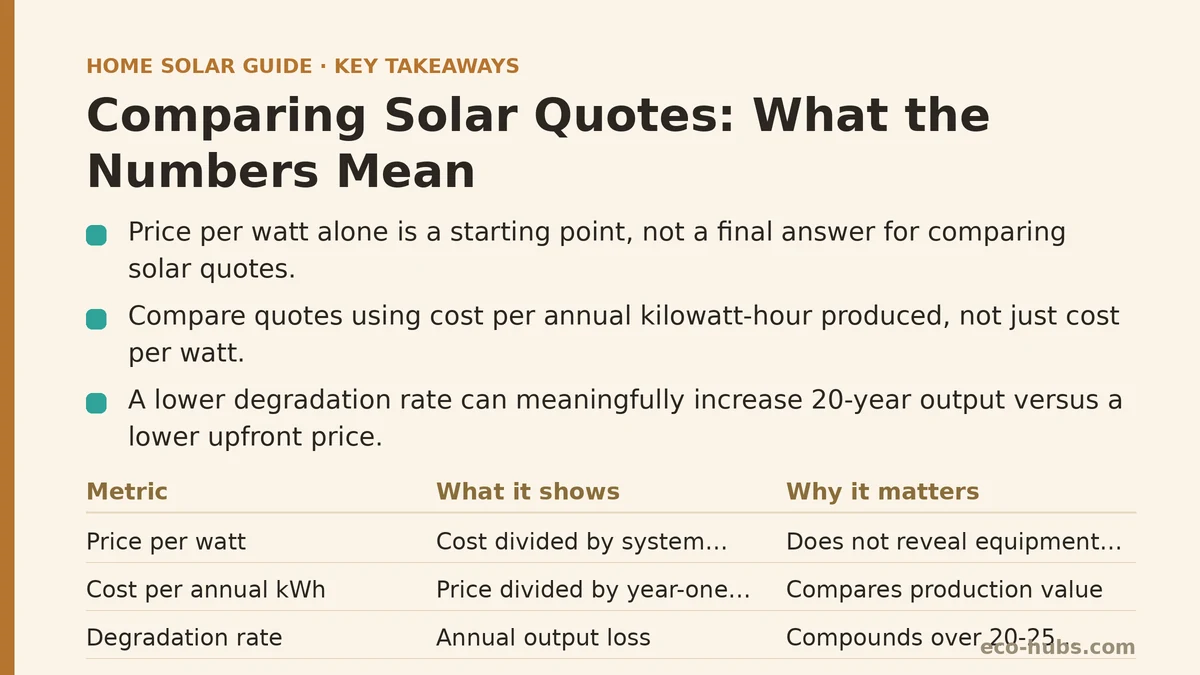
1. Price Per Watt Is a Starting Point, Not a Final Answer
The first number most homeowners compare is price per watt, calculated by dividing the total system cost by the system size in watts. A $30,000 system at 8 kilowatts (8,000 watts) works out to $3.75 per watt. The national average in 2026 sits between $2.80 and $3.50 per watt for a professionally installed residential system, but that range masks enormous variation by region, roof complexity, and equipment quality.
Here is the catch: price per watt does not tell you what equipment you are buying. A $2.90-per-watt quote using a low-efficiency panel with a 12-year product warranty is not comparable to a $3.20-per-watt quote using a premium panel with a 25-year product warranty and a lower degradation rate. The difference in the final 20 years of production can exceed the upfront price gap.
Check each quote for the specific panel model, inverter model, and mounting system. If two quotes list different equipment, divide the total price by the total wattage of the proposed array to get an apples-to-apples price per watt for that specific combination. That lets you compare like for like, qualified by the equipment differences.
2. System Size and Production Output Are Two Different Numbers
A quote might propose an 8 kW system that produces 10,500 kilowatt-hours in year one. Another quote might propose a 7.6 kW system that produces 10,200 kilowatt-hours. The second system is smaller but nearly as productive because of better panel orientation, higher-efficiency modules, or less shading.
You do not pay for production directly — you pay for the equipment and installation. But your savings depend on production. The right comparison is not just cost per watt but cost per annual kilowatt-hour produced. Divide the total system price by the estimated year-one production to get this figure. A system that costs $0.28 per annual kilowatt-hour produced is a better production value than one at $0.33, even if the second one’s price per watt looks lower.
Check what assumptions went into the production estimate. A quote projecting high output might be using a favorable sun-hour number for your location, ignoring a neighbor’s shading tree, or assuming a south-facing roof that does not match your actual orientation as covered in our production estimates guide. Ask for the specific assumptions, and compare those assumptions against the other quote you have.
3. The Degradation Rate Changes Your 20-Year Output More Than the Initial Price
Every solar panel loses output over time. The industry standard degradation rate is around 0.5 percent per year, but premium panels can drop as low as 0.25 percent per year, while budget panels might degrade at 0.7 percent or higher. That small difference compounds significantly.
A 5 kW system producing 7,500 kilowatt-hours in year one will produce about 6,860 kilowatt-hours in year 25 at 0.5 percent annual degradation. At 0.35 percent degradation, year-25 output is about 6,890 kilowatt-hours. Over 25 years, the 0.15 percent difference adds up to roughly 900 more kilowatt-hours — enough to power a household for about a month and a half in most of the country.
Worth asking each installer for the specific degradation curve on the panels they proposed, not just the warranty term. The difference between a 25-year warrantied panel at 85 percent retained output and one at 92 percent retained output shows up in your utility bill in the final decade of the system’s life.
4. Inverter Type and Replacement Timing Are Hidden Cost Centers
String inverters cost less upfront, typically in the $1,500 to $2,500 range for a residential system, but they carry a 10 to 12-year replacement cycle. A premium string inverter may last 15 years, but the practical number to budget for is a replacement at roughly the 12-year mark. A second replacement in year 24 means two inverter replacements over the typical 25-year panel life.
Microinverters cost more per watt, usually $0.15 to $0.30 more per watt, but they carry 20 to 25-year warranties and often do not need replacement during the panel’s warranted lifetime. Optimizers plus a string inverter fall between these two, with the optimizer warranty typically matching the panel warranty while the string inverter itself has the shorter replacement cycle.
Compare the quotes on total 25-year inverter cost, not just the upfront figure. A $34,000 quote with microinverters may be cheaper over 25 years than a $30,000 quote with a string inverter that needs two replacements at $2,000 each plus labor, which adds $4,000 to $5,000 of undiscounted future cost to the lower upfront number.
5. Financing Terms Can Shift the Real Cost by Thousands
A quote that looks 15 percent more expensive on cash price may be the better deal once you feed in loan terms. Solar loans fall into two broad categories: secured loans backed by your home’s equity or a UCC lien on the system, and unsecured personal loans. The rates differ by one and a half to three points depending on the lender and your credit profile.
The rate is not the only number that matters. Look for dealer fees — sometimes hidden as a “loan origination fee” or built into the quoted price — which effectively add 5 to 20 percent to the equipment cost while keeping the headline rate low. A 3.99 percent rate with a 15 percent dealer fee can cost more in total than a 5.99 percent rate with no fee over a 20-year term.
Calculate your monthly payment from the actual quoted price, not the advertised rate. Use that payment against the projected monthly savings from your production estimate. If the payment exceeds savings, you are financing a net cost. That is not necessarily wrong, but you should see it in the numbers before signing, not discover it after your first annual true-up statement as discussed in our financing guide.
At-a-Glance Comparison Table
| Number on the Quote | What It Tells You | What It Hides |
|---|---|---|
| Price per watt | Cost efficiency per unit of size | Equipment quality, labor scope, permit fees |
| Total system price | Out-of-pocket cost | Dealer fees, financing markup, future inverter replacements |
| Year-one production | Expected first-year output | Degradation rate assumptions, shading model accuracy |
| Panel efficiency rating | Physical output per square foot of roof | Degradation over time, temperature coefficient behavior |
| Inverter type | Conversion efficiency and warranty structure | Replacement cost/timing over 25 years |
| Loan APR | Borrowing cost per year | Dealer fees, prepayment penalties, fee-inclusive rate |
The Number That Predicts Your Payback Most Accurately
Your payback period is not the price per watt and not the total system cost. It is the relationship between your net system cost and your annual savings, adjusted for what you would have paid the utility over the same period and for the time value of money, a concept our payback period guide covers with worked examples.
Calculate it this way: subtract any tax credits, rebates, or utility incentives from the total system price to get your net cost. Divide that net cost by your expected annual savings in the first full year plus the annual value of any net metering credits or exported energy payments. That yields a simple payback in years. Add one to two years to account for the fact that utility rates historically rise faster than the conservative escalation rate most installers use in their projections.
A simple payback of 8 to 10 years on a 25-year warrantied system is a defensible investment. A payback past 13 years typically signals either a poor production estimate, an overpriced system, or a location where solar economics do not support installation at current costs. That second scenario is worth explaining directly rather than being buried under a low monthly payment figure.
Check the Assumption List Before You Compare Anything
Every production estimate rests on a set of assumptions your installer chose. The tilt of your roof, the azimuth direction, the number of peak sun hours for your ZIP code, the shading tree that will grow taller in 10 years, and the temperature derating curve for your climate all feed into the final year-one number.
Obtain the same assumption list from each installer and put them side by side. If one installer assumes 5.2 peak sun hours per day and another assumes 4.6 for the same roof, find out why. The roof does not change because the installer changed. If the difference comes from a genuine modeling approach, you can accept it. If it comes from a more optimistic assumption, adjust the production estimate downward on that quote before you compare it with the others.
Thirty-Minute Next Step
Gather the three quotes you have and a spreadsheet or a blank sheet of paper. For each quote, write down the four numbers that matter: total installed cost, price per watt, year-one production estimate, and the annual degradation rate of the proposed panels. Calculate your simple payback period using the formula above, using a 3 percent annual utility rate escalation for the savings side.
If two quotes are within 5 percent on both price per watt and production, the decision comes down to warranty structure, installer track record, and financing terms. If one quote beats another by more than 10 percent on the cost-per-kWh-produced figure, the lower one is worth a serious second look.
Related guides: How to Compare Solar Installer Quotes for an Apples-to-Apples Decision, A Financial Advisor’s Guide to Calculating Client Solar ROI Scenarios, and How to Actually Calculate Your Solar Panel Payback Period.
🔗 Recommended Reading
- Solar Panel Monitoring Apps: A Setup Guide for Beginners
- How to Read Your Electricity Bill After Solar: A Line-by-Line Walkthrough
- Solar Incentive Paperwork: Common Filing Mistakes That Delay Your Rebate
- Home Battery Sizing Mistakes That Lead to Blackout Regret
- Common Solar Installer Mistakes Homeowners Should Catch Before Signing